SDI - Lernmaterialien / Lessons on Spatial Data Infrastructure
Abschnittsübersicht
-

SDI - Lernmaterialen / Lessons on Spatial Data Infrastructure
Dieser Kurs beinhaltet eine Sammlung von offenen Lernmaterialien zum Thema Geodateninfrastrukturen, die im Rahmen des vom MKW NRW geförderten OER4SDI-Projektes erstellt wurden. Die Materialien sollen Studierende in geoinformationsbezogenen Studiengängen dabei unterstützen, ein umfassendes Verständnis der Architektur, Implementierung und Nutzung von Geodateninfrastrukturen zu erlangen. Die Lektionen adressieren die konzeptionellen, technischen und rechtlichen Grundlagen verteilter Geodateninfrastrukturen sowie Ansätze für deren Entwicklung und Verwaltung auf regionaler, nationaler und internationaler Ebene.
Die Materialien sind auf der ORCA.NRW Plattform für Open Educational Resources (OER) publiziert und können über openRUB online angewendet werden.
Sämtliche Quellen und aktuelle Entwicklungsstände der Materialien finden Sie im GitHub-Repository des OER4SDI-Projektes. Weitere Infos finden Sie auf der Projekt-WebSite.
This course contains a collection of open learning materials on the topic of spatial data infrastructures, which were created in the context of the OER4SDI project funded by MKW NRW. The materials are designed to support students in geoinformation-related degree programs in gaining a comprehensive understanding of the architecture, implementation and use of spatial data infrastructures. The lessons address the conceptual, technical and legal foundations of distributed spatial data infrastructures as well as approaches to their development and management at regional, national and international levels.
The materials are published on the ORCA.NRW platform for Open Educational Resources (OER) and can be used online via openRUB.
All sources and the current development status of the materials can be found in the GitHub repository of the OER4SDI project. Further information can be found on the OER4SDI project website
Übersicht / Overview OER Lessons Einführung Geoinformatik
Lernmodule zur Einführung in die Geoinformatik:
-
Geographische Informationssysteme
-
Koordinatensysteme und Projektionen
-
Digitalisieren, selektieren und manipulieren
-
Kartenlayouts und kartographische Best Practices
-
Vektordatenanalyse
-
Rasterdatenanalyse
Einführung in das AAA Datenmodel
Wie viel Wald gibt es in einem Landkreis? Wie gut ist eine Gemeinde mit Kitas versorgt? Solche Fragen erfordern räumliche Daten, die in Deutschland als Geobasisdaten im AFIS-ALKIS-ATKIS Modell vorliegen. Diese videobasierte Lerneinheit stellt das Modell vor und bietet erste praktische Erfahrungen im Umgang mit den Daten.SDIs for Wind Farm Planning (English)
Using the planning of a wind farm in the municipality of Lorup in Lower Saxony, we will examine how geospatial information infrastructures support the availability and usability of data. You will learn why the planning of wind farms requires easy access to up-to-date, high-quality spatial data and what kind of data is needed here. You will be able to retrieve the data needed for planning in spatial data infrastructures and use them in GIS analyses.
Anhand der Planung eines Windparks in der Gemeinde Lorup in Niedersachsen untersuchen wir, wie Geoinformationsinfrastrukturen die Verfügbarkeit und Nutzbarkeit von Daten unterstützen. Du wirst lernen, warum die Planung von Windparks einen einfachen Zugang zu aktuellen, hochwertigen Geodaten erfordert und welche Art von Daten hier benötigt werden. Du wirst in der Lage sein, die für die Planung benötigten Daten in Geodateninfrastrukturen aufzufinden in GIS-Analysen zu verwenden.
Digitale Kartografie - ArcGIS Online StoryMaps
In diesem Lernmaterial geht es darum, wie man eine "Story Map", ein Feature in ArcGIS Online, erstellt. Wir werden ein reales Beispiel verwenden, um unsere eigene Website zu erstellen. Aufgabe ist es, eine Story Map zu erstellen, die den Unfallatlas von 2023 in NRW vorstellt. Der Fokus soll dabei auf Fahrradunfällen liegen.
Digitale Kartografie - ArcGIS Online Dashboards
In diesem Lernmaterial lernst du ArcGIS-Online Dashboards kennen. Das Tutorial vermittelt, wozu Dashboards gut sind, wie man sie erstellt und nutzt, und wie man sie anderen Nutzern verfügbar macht.
Einführung in die Fernerkundung
Offene Lernmaterialien (OER - Open Educational Resources) zum Thema Fernerkundung:
-
Fernerkundung Einführung
-
Satellitenvermessung mit elektromagnetischer Strahlung und Interpretation
-
Klassifikation
Knowledge Graphs
Offenes Lernmaterial (OER - Open Educational Resource) zum Thema Semantic Web und Linked Data. Das OER-Modul bietet a) einige Hintergrundinformationen zu den Konzepten des Semantischen Web mit Anwendungsbeispielen aus der Praxis und b) eine technische Anleitung zur Erstellung von Ontologien und Abfrage-Mechaniken.
DCAT - The Data Catalog Vocabulary (English)
In this tutorial, you will learn about DCAT (the Data Catalog Vocabulary), a standardized data model for describing information resources on the web. You will see how DCAT is used in practice. You will gain practical experience in editing and validating DCAT-based metadata and in managing and querying DCAT metadata with RDF triple stores and SPARQL.
In diesem Tutorial lernst Du DCAT kennen. DCAT steht für "Data Catalog Vocabulary" und ist ein standardisiertes Datenmodell zur Beschreibung von Informationsressourcen im WEB. Du wirst sehen, wie DCAT in der Praxis eingesetzt wird. Du sammelst praktische Erfahrungen in der Bearbeitung und Validierung von DCAT-basierten Metadaten und in der Verwaltung und Abfrage von DCAT-Metadaten mit RDF-Triple-Stores und SPARQL.
Geospatial Web Services
Das offene Lernmaterial bietet a) einige Hintergrundinformationen zu Geospatial Web Services und b) eine technische Anleitung zur Nutzung von Geospatial Web Services in einem Open Source Gis (QGIS) sowie einem Open Source Server (GeoServer).
Metadata Access via OGC CSW (English)
This tutorial will help you understand how metadata is provided and used in SDIs. In particular, we will look at metadata based on ISO standards, as well as interfaces for querying and accessing metadata according to the OGC Catalog Services for the Web (OGC CSW) specification. After completing this tutorial, you will be able to query and use OGC Catalog Services via Python and QGIS.
Dieses Tutorial hilft Dir zu verstehen, wie Metadaten in SDIs bereitgestellt und verwendet werden. Wir werden uns insbesondere mit Metadaten auf der Grundlage von ISO-Standards sowie mit Schnittstellen für die Abfrage und den Zugriff auf Metadaten gemäß der OGC-Spezifikation von Catalog Services for the Web (OGC CSW) befassen. Nach Abschluss dieses Tutorials wirst Du in der Lage sein, OGC-Katalogdienste über Python und QGIS abzufragen und zu nutzen.
Data Access via OGC API Features (English)
This tutorial will help you understand how metadata is provided and used in SDIs. In particular, we will look at metadata based on ISO standards, as well as interfaces for querying and accessing metadata according to the OGC specification of Catalog Services for the Web (OGC CSW). After completing this tutorial, you will be able to query and use OGC Catalog services via Python and QGIS.Dieses Tutorial hilft dir zu verstehen, wie Metadaten in SDIs bereitgestellt und verwendet werden. Insbesondere werden wir uns mit Metadaten auf der Grundlage von ISO-Standards sowie mit Schnittstellen für die Abfrage und den Zugriff auf Metadaten gemäß der OGC-Spezifikation von Catalog Services for the Web (OGC CSW) befassen. Nach Abschluss dieses Tutorials wirst du in der Lage sein, OGC-Katalogdienste über Python und QGIS abzufragen und zu nutzen.Spatial Data Streaming (English)
In this technical tutorial, you will learn how to use Kafka and Jupyter notebooks to process and analyze streams of sensor data (particulate matter, PM2.5).
In diesem technischen Tutorial lernst Du, wie Du mit Kafka- und Jupyter-Notebooks Ströme von Sensordaten (Feinstaub, PM2,5) verarbeiten und analysieren kannst.
INSPIRE View and Download Services (English)
In this technical tutorial, you will learn how to work with INSPIRE view and download services. The objectives are to understand the characteristics of INSPIRE view and download services and to gain practical experience in working with these resources.
In diesem technischen Tutorial lernst Du, wie Du mit INSPIRE-Ansichts- und Downloaddiensten arbeiten kannst. Es geht darum, die besonderen Merkmale der INSPIRE-Ansichts- und Downloaddienste zu verstehen und praktische Erfahrung im Umgang mit diesen Ressourcen zu gewinnen.
Copernicus Data Space Ecosystem (CDSE) and OpenEO (English)
This technical tutorial on the Copernicus Data Infrastructure is about the Copernicus Data Space Ecosystem (CDSE) and processing Earth Observation data with Python and OpenEO. In the practical part of the tutorial, you will investigate the impact of a heavy rainfall event in 2021 on the city of Ahrweiler in Germany. You will use a Jupyter notebook on your local computer to process Sentinel-2 data in the cloud and visualize the results on your local computer.
In diesem technischen Tutorial zur Copernicus-Dateninfrastruktur geht es um das Copernicus Data Space Ecosystem (CDSE) und die Verarbeitung von Erdbeobachtungsdaten mit Python und OpenEO. Im praktischen Teil des Tutorials wirst Du die Auswirkungen eines Starkregenereignisses in 2021 auf die Stadt Ahrweiler in Deutschland untersuchen. Du wirst ein JupyterNotebook auf Deinem lokalen Computer nutzen, um Sentinel-2-Daten in der Cloud zu prozessieren und die Ergebnisse wiederum auf Deinem lokalen Computer zu visualisieren.
Geospatial Digital Twins (English)
A digital twin is a virtual replica or representation of a physical system such as a city, building, machine etc. It replicates the characteristics, state and behavior of the physical system in real-time, and it is updated using real-time data. In this OER module, you will learn about the concept of geospatial digital twins and explore some fields of application. You will create a simple digital twin application using publicly available datasets from the City of Hamburg.
Ein digitaler Zwilling ist eine virtuelle Repräsentation eines physischen Systems wie einer Stadt, eines Gebäudes, einer Maschine usw. Er repliziert die Eigenschaften, den Zustand und das Verhalten des physischen Systems in Echtzeit und wird anhand von Echtzeitdaten aktualisiert. In diesem OER-Modul lernst Du das Konzept der georäumlichen digitalen Zwillinge kennen und erkundest einige Anwendungsbereiche. Du erstellst eine einfache digitale Zwilling-Anwendung unter Verwendung öffentlich zugänglicher Datensätze der Stadt Hamburg.
Docker - Einführung in Docker zur Geodatenverarbeitung
Der Kurs zeigt, wie Docker zur Bereitstellung und Skalierung von GIS-Anwendungen genutzt wird. Es ermöglicht isolierte Container für eine effiziente und flexible GIS-Entwicklung, ohne aufwendige Softwareinstallationen, und schafft eine einheitliche Umgebung für Webdienste und Analysen.



-
-
Offene Lernmaterialien (OER - Open Educational Resources) zur Einführung in die Geoinformatik:
- Geographische Informationssysteme
- Koordinatensysteme und Projektionen
- Digitalisieren, selektieren und manipulieren
- Kartenlayouts und kartographische Best Practices
- Vektordatenanalyse
- Rasterdatenanalyse
Die Module sind wie folgt aufgebaut:
- Überblick
- Kurze Einführung in das Thema
- Inhaltliche Vertiefung
- Übungen und Leitfäden
- Quiz
- Zusammenfassung
Die Lernmodule sind hauptsächlich für Studenten entwickelt, die jeweils etwa 30-60 Minuten damit verbringen wollen ihr Wissen zu Einführungsthemen der Geoinformatik zu vertiefen.
Die OERs sind als H5P-Module implementiert, die heruntergeladen und in jede H5P-Laufzeitumgebung eingebettet werden können, wie z.B.:
- Lernmanagementsysteme auf Basis von Moodle oder Ilias
- H5P-Bearbeitungsumgebungen wie der H5P Official Editor oder der leichtgewichtige LUMI H5P Editor
- Inhaltsverwaltungssysteme wie Wordpress mit installiertem "H5P"-Plugin
Lade dir einfach nur die H5P-Dateien herunter und anschließend wieder in eine der genannten Umgebungen hoch, um sie von dort aus zu verwenden.
Schneller Überblick über die Inhalte
Wenn du dir zunächst einen schnellen Überblick über die konkreten Inhalte der H5P-Module verschaffen willst, findest du im Storyboard ein nach den H5P-Modulen strukturiertes Skript mit integrierten Illustrationen.
Sie dürfen den Inhalt des Tutorials unter den Bedingungen der CC-BY-SA 4.0 Lizenz frei verwenden, verändern und weitergeben, sofern nicht ausdrücklich etwas anderes für bestimmte Teile des Inhalts angegeben ist. Alle verwendeten Logos sind generell ausgenommen.
Jeglicher Code, der mit dem Tutorial zur Verfügung gestellt wird, kann unter den Bedingungen der MIT-Lizenz verwendet werden. Bitte lesen Sie die vollständigen Lizenzbedingungen: https://github.com/oer4sdi/OER-EinfuehrungGeoinformatik/blob/main/LICENSE.md.
Das Tutorial kann wie folgt referenziert werden: „OER-EinfuehrungGeoinformatik“, OER4SDI Projekt / Hochschule Bochum, CC BY-SA 4.0.
Diese OER-Module wurden im Kontext des Projektes OER4SDI am Institut für Geodäsie der Hochschule Bochum in enger Zusammenarbeit mit der Westfälischen Universität Münster und der Ruhr Universität Bochum entwickelt. Hauptautoren sind Fabian Przybylak, Lena Pfeil und Jonas Haine unter der Leitung von Prof. Dr. Carsten Keßler.
Das Projekt OER4SDI wurde von der Digitalen Hochschule NRW empfohlen und wird durch das Ministerium für Kultur und Wissenschaft NRW gefördert.
Aktivitäten 6 -

In diesem Lernmaterial geht es darum, wie man eine "Story Map", ein Feature in ArcGIS Online, erstellt. Wir werden ein reales Beispiel verwenden, um unsere eigene Website zu erstellen. Die Aufgabe ist es eine Story Map zu erstellen, die den Unfallatlas von 2023 in NRW vorstellt. Der Fokus soll dabei auf Fahrradunfällen liegen.
Du wirst lernen:
- In welchen Szenarien Story Maps ein nützliches Werkzeug sein können
- Wie du eine Story Map erstellen kannst
- Welche Funktionen es gibt, um deine Website zu verbessern
Inhaltliche Struktur
1. Überblick
2. Hintergrund
3. Aufbereitung der Daten
4. Erstellen der Story Map
5. Verbessern einer Story Map
6. Zusammenfassung und Diskussion
7. Überprüfe dein Wissen
8. Referenzen
Zielgruppe und Voraussetzungen
Dieses Tutorial richtet sich an Studierende, die ihre Daten interaktiv darstellen und geografische Daten mit multimedialen Elementen kombinieren möchten, um ihre Daten und Projekte besser zu kommunizieren. Wir setzen voraus, dass sie über Grundkenntnisse in der ArcGIS-Welt verfügen und/oder mit einem anderen GIS arbeiten können.
Auch ein Zugang zu ArcGIS Online ist eine Voraussetzung. Da die Lizenz sehr viel kostet, wird hier nicht erwartet, dass du dir ArcGIS Lizenzen kaufst. Sehr oft gibt es gratis Lizenzen, zum Beispiel bereitgestellt von Universitäten. Falls du darauf nicht zurückgreifen kannst, ist es aber auch möglich, eine gratis Testversion zu beantragen und damit eine Story Map zu erstellen.Offene Lizenz
-Lizenz verwenden, ändern und weitergeben, es sei denn, für bestimmte Teile des Inhalts ist ausdrücklich etwas anderes angegeben.
Alle verwendeten Logos sind generell ausgenommen. Soweit mit dem Tutorial Software-Code bereitgestellt wird, kann dieser unter den Bedingungen der MIT-Lizenz verwendet werden. Die vollständigen Lizenzbedingungen findest du
Das Tutorial kann wie folgt referenziert werden: „OER-DigiKarto-StoryMaps“, OER4SDI-Projekt / Universität Münster,
Autoren und Förderhinweis
Nutzung
Aktiviere einfach den nachfolgenden Link zum H5P-Lernmodul:
Aktivitäten 1 -
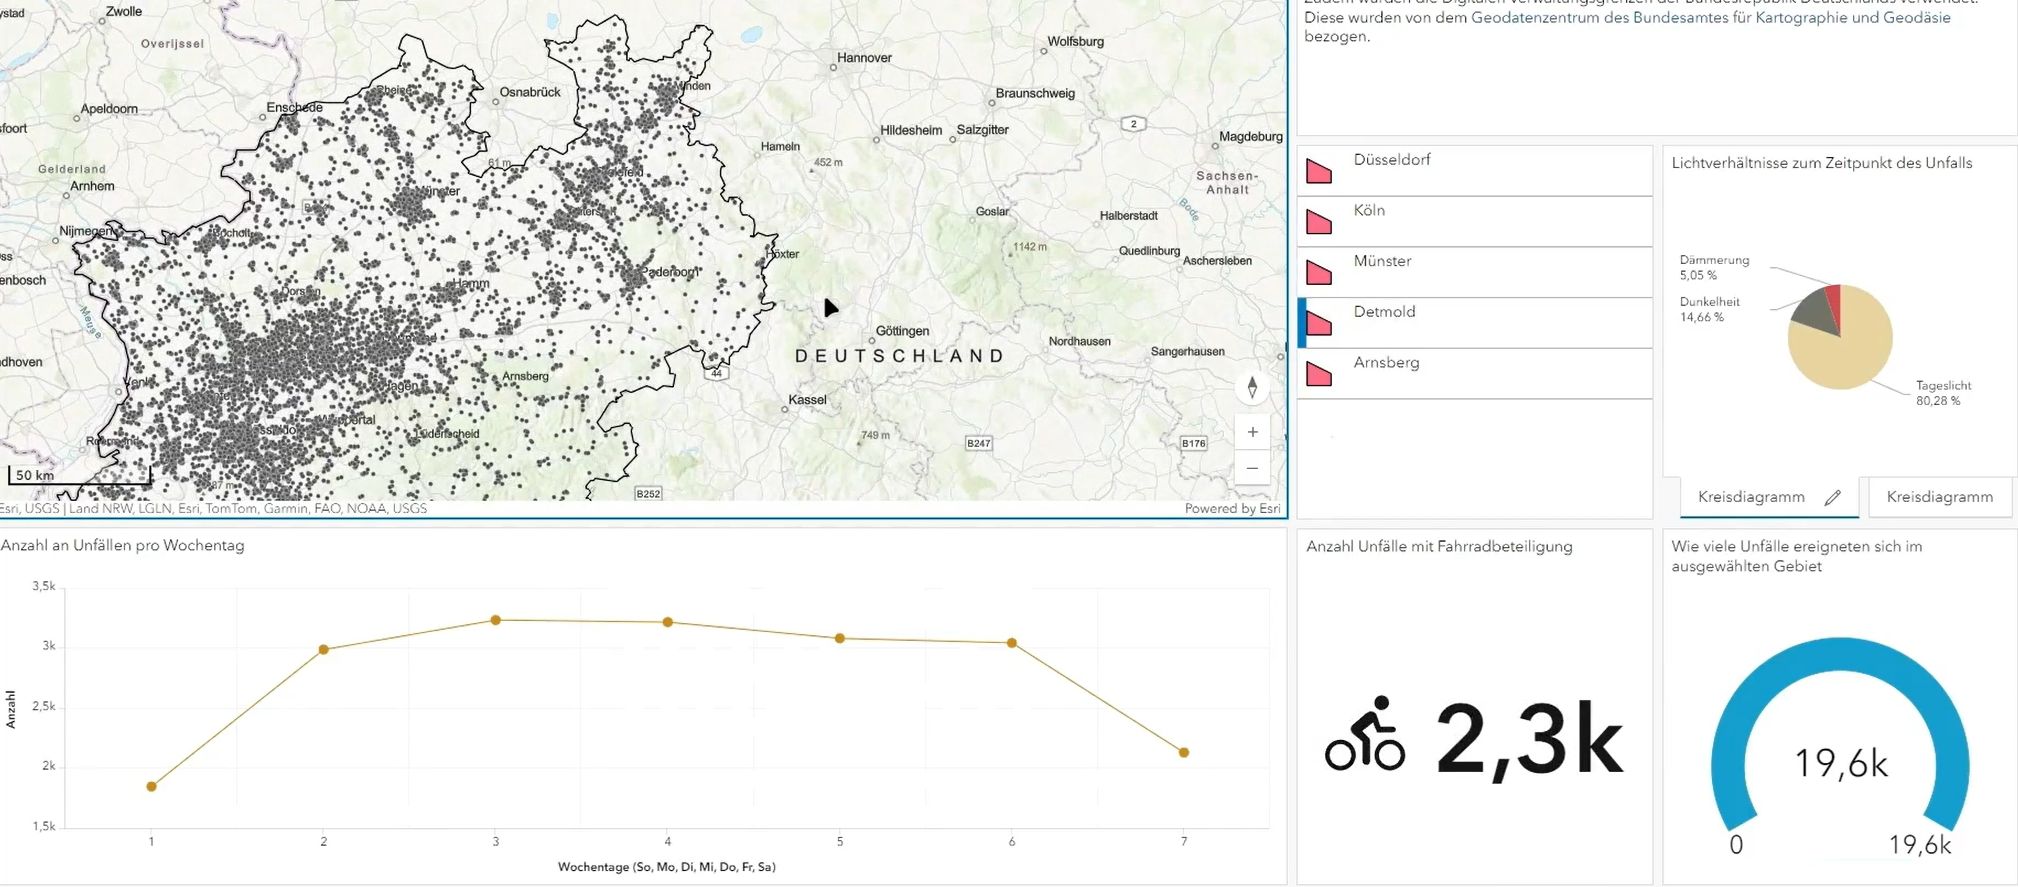 In diesem Lernmaterial lernst du ArcGIS-Online Dashboards kennen. Das Tutorial vermittelt, wozu Dashboards gut sind, wie man sie erstellt und nutzt, und wie man sie anderen Nutzern verfügbar macht.
Lernziele
- Grundverständnis der Natur eines Dashboards- Einsatzfelder und Nutzen- Erstellung und VerbreitungInhaltliche Struktur
- Überblick- Einführung- Vorbereitung- Erstellung eines Dashboards- Dashboard-Elemente- Filtern- Zusammenfasssung- ReferenzenZielgruppe und Voraussetzungen
Dieses Tutorial richtet sich an Studierende, die lagebezogene Daten statistisch Auswerten und die Ergebnisse überschaubar visualisieren möchten. Wir setzen voraus, dass sie über Grundkenntnisse in der ArcGIS-Welt verfügen und/oder mit einem anderen GIS arbeiten können.Auch ein Zugang zu ArcGIS Online ist eine Voraussetzung. Da die Lizenz sehr viel kostet, wird hier nicht erwartet, dass du dir ArcGIS Lizenzen kaufst. Sehr oft gibt es gratis-Lizenzen, zum Beispiel bereitgestellt von Universitäten. Falls du darauf nicht zurückgreifen kannst, ist es aber auch möglich, eine gratis-Testversion zu beantragen und damit ein Dashboard zu erstellen.Offene Lizenz
-Lizenz verwenden, ändern und weitergeben, es sei denn, für bestimmte Teile des Inhalts ist ausdrücklich etwas anderes angegeben.
Alle verwendeten Logos sind generell ausgenommen. Soweit mit dem Tutorial Software-Code bereitgestellt wird, kann dieser unter den Bedingungen der MIT-Lizenz verwendet werden. Die vollständigen Lizenzbedingungen findest du
Das Tutorial kann wie folgt referenziert werden: „OER-DigiKarto-Dashboard“, OER4SDI-Projekt / Universität Münster,.
Autoren und Förderhinweis
Nutzung
Aktiviere einfach den nachfolgenden Link zum H5P-Lernmodul:
Aktivitäten 1 -
Das AAA-Datenmodell, das in dieser Lerneinheit vorgestellt wird, ist ein wichtiger Bestandteil im Bereich der Datenverwaltung und Datenanalyse. Diese videobasierte Lerneinheit bietet eine Einführung in das Modell und ermöglicht es den Teilnehmern, erste praktische Erfahrungen im Umgang mit den Daten zu sammeln.
Nutzung
Sie Können die Lerneinheit direkt hier auf OpenRUB abrufen.
Sie dürfen das Tutorial (Videos,Text) unter den Bedingungen der CC-BY-SA 4.0-Lizenz frei nutzen, ändern und reproduzieren. Jeder Code, der mit dem Tutorial bereitgestellt wird, kann unter den Bedingungen der MIT-Lizenz verwendet werden. Die vollständigen Lizenzbedingungen finden Sie unter https://github.com/oer4sdi/OER-MetadataAccessVia-OGC-CSW.
Dieses Tutorial wurde am Institut für Geographie der Ruhr Universität Bochum entwickelt. Die Autoren sind Henryk Hodam, Lars Tum Andreas Rienow und Dennis Edler. Das Projekt OER4SDI wurde von der Digitalen Hochschule NRW empfohlen und wird vom Ministerium für Kultur und Wissenschaft NRW finanziert.
Das Projekt OER4SDI, das sich mit offenen Bildungsressourcen im Bereich der räumlichen Dateninfrastruktur befasst, erhält seine Empfehlung von der Digitalen Hochschule NRW und finanzielle Unterstützung vom Ministerium für Kultur und Wissenschaft NRW. Diese Unterstützung unterstreicht die Bedeutung des Projekts für die Bildungslandschaft in Nordrhein-Westfalen und darüber hinaus.
Aktivitäten 0 -

How Spatial Information Infrastructures Support the Planning of Wind Farms
(August 2024)
In this learning material, we use the real-world use case of planning the extension of a wind farm in the municipality of Lorup in Lower Saxony, Germany, to explore how geoinformation infrastructures support the availability and use of geospatial data needed in the wind farm planning process.
You will learn,
- why wind farm planning requires easy access to up-to-date, high-quality geospatial data and what kind of data is needed,
- how SIIs facilitate the discoverability, accessibility, and usability of geospatial data that is needed for wind farm planning.
Content Structure
-
Overview
-
Background
-
Planning the extension of a wind farm in Lorup, Germany
-
Summary and discussion
-
Check your Knowledge
Target Group and Prequistes
This tutorial is designed for students and professionals who want to improve their understanding of Spatial Information Infrastructures. We assume that you have some basic knowledge about geospatial data, QGIS and spatial data analysis. You will need about 90 minutes to use this tutorial.
License Statement
You are free to use, alter and share the tutorial under the terms of the CC-BY-SA 4.0 license, unless explicitly stated otherwise for specific parts of the content.
The tutorial can be referenced as follows: “OER-SDI4WindFarmPlanning”, OER4SDI project / University Münster, CC BY-SA 4.0.
All logos used are generally excluded. Any code provided with the tutorial can be used under the terms of the MIT license. Please see the full license terms: https://github.com/oer4sdi/OER-WindFarmExtension/edit/main/LICENSE.md)
Authors and Funding
This Tutorial has been developed in the context of the OER4SDi project at the Institute for Geoinformatics, University of Münster. Authors are Nouran Armanazi and Albert Remke with contributions from Stefan Lütkemeyer (Revento GmbH).
The OER4SDI project has been recommended by the Digital University NRW and is funded by the Ministry of Culture and Science NRW.
Aktivitäten 1 -
Offene Lernmaterialien (OER - Open Educational Resources) zum Thema Fernerkundung:
- Fernerkundung Einführung
- Satellitenvermessung mit elektromagnetischer Strahlung und Interpretation
- Klassifikation
Die Module sind wie folgt aufgebaut:
- Überblick
- Kurze Einführung in das Thema
- Inhaltliche Vertiefung
- Übungen und Leitfäden
- Quiz
- Zusammenfassung
Die Lernmodule sind hauptsächlich für Studenten entwickelt, die jeweils etwa 30-60 Minuten damit verbringen wollen ihr Wissen zum Thema Fernerkundung zu vertiefen.
Die OERs sind als H5P-Module implementiert, die heruntergeladen und in jede H5P-Laufzeitumgebung eingebettet werden können, wie z.B.:
- Lernmanagementsysteme auf Basis von Moodle oder Ilias
- H5P-Bearbeitungsumgebungen wie der H5P Official Editor oder der leichtgewichtige LUMI H5P Editor
- Inhaltsverwaltungssysteme wie Wordpress mit installiertem "H5P"-Plugin
Lade dir einfach die H5P-Dateien herunter und lade diese anschließend wieder in eine der genannten Umgebungen hoch, um sie von dort aus zu verwenden.
Schneller Überblick über die Inhalte
Wenn du dir zunächst einen schnellen Überblick über die konkreten Inhalte der H5P-Module verschaffen willst, findest du für alle enthaltenen Module im Storyboard eine kurze Zusammenfassung der Inhalte.
Sie dürfen den Inhalt des Tutorials unter den Bedingungen der CC-BY-SA 4.0 Lizenz frei verwenden, verändern und weitergeben, sofern nicht ausdrücklich etwas anderes für bestimmte Teile des Inhalts angegeben ist. Alle verwendeten Logos sind generell ausgenommen.
Jeglicher Code, der mit dem Tutorial zur Verfügung gestellt wird, kann unter den Bedingungen der MIT-Lizenz verwendet werden. Bitte lesen Sie die vollständigen Lizenzbedingungen: https://github.com/oer4sdi/OER-Fernerkundung/blob/main/LICENSE.md.
Das Tutorial kann wie folgt referenziert werden: „OER-Fernerkundung“, OER4SDI Projekt / Hochschule Bochum, CC BY-SA 4.0.
Diese OER-Module wurden im Kontext des Projektes OER4SDI am Institut für Geodäsie der Hochschule Bochum in enger Zusammenarbeit mit der Westfälischen Universität Münster und der Ruhr Universität Bochum entwickelt. Hauptautor ist Lucas Rudnik in Zusammenarbeit mit Fabian Przybylak und unter der Leitung von Prof. Dr. Carsten Keßler.
Das Projekt OER4SDI wurde von der Digitalen Hochschule NRW empfohlen und wird durch das Ministerium für Kultur und Wissenschaft NRW gefördert.
Aktivitäten 3 -
Offenes Lernmaterial (OER - Open Educational Resource) zum Thema Semantic Web und Linked Data. Das OER-Modul bietet a) einige Hintergrundinformationen zu den Konzepten des Semantischen Web mit Anwendungsbeispielen aus der Praxis und b) eine technische Anleitung zur Erstellung von Ontologien und Abfrage-Mechaniken.
Das Modul ist wie folgt aufgebaut
- Überblick
- Thematischer Hintergrund
- Übungen und Leitfäden
- Quiz
- Zusammenfassung
Dieses Tutorial ist hauptsächlich für Studenten gedacht, die etwa 30 Minuten damit verbringen wollen, ihr Wissen zu semantischer Wissensmodellierung zu vertiefen.
Das OER ist als H5P-Modul implementiert, das heruntergeladen und in jede H5P-Laufzeitumgebung eingebettet werden kann, wie z.B.:
- Lernmanagementsysteme auf Basis von Moodle oder Ilias
- H5P-Bearbeitungsumgebungen wie der H5P Official Editor oder der leichtgewichtige LUMI H5P Editor
- Inhaltsverwaltungssysteme wie Wordpress mit installiertem "H5P"-Plugin
Lade dir einfach nur die H5P-Datei herunter, lade sie in eine der Umgebungen hoch und verwende sie von dort aus.
Wenn du dir zunächst einen schnellen Überblick über die konkreten Inhalte des H5P-Moduls verschaffen willst, findest du im Storyboard ein nach dem H5P-Modul strukturiertes Skript mit integrierten Illustrationen.
Sie dürfen den Inhalt des Tutorials unter den Bedingungen der CC-BY-SA 4.0 Lizenz frei verwenden, verändern und weitergeben, sofern nicht ausdrücklich etwas anderes für bestimmte Teile des Inhalts angegeben ist. Alle verwendeten Logos sind generell ausgenommen.
Jeglicher Code, der mit dem Tutorial zur Verfügung gestellt wird, kann unter den Bedingungen der MIT-Lizenz verwendet werden. Bitte lesen Sie die vollständigen Lizenzbedingungen: https://github.com/oer4sdi/OER-KnowledgeGraph/blob/main/LICENSE.md.
Das Tutorial kann wie folgt referenziert werden: „OER-KnowledgeGraph“, OER4SDI Projekt / Hochschule Bochum, CC BY-SA 4.0.
Diese OER-Module wurden im Kontext des Projektes OER4SDI am Institut für Geodäsie der Hochschule Bochum in enger Zusammenarbeit mit der Westfälischen Universität Münster und der Ruhr Universität Bochum entwickelt. Hauptautor ist Fabian Przybylak unter der Leitung von Prof. Dr. Carsten Keßler und in Zusammenarbeit mit Lucas Rudnik.
Das Projekt OER4SDI wurde von der Digitalen Hochschule NRW empfohlen und wird durch das Ministerium für Kultur und Wissenschaft NRW gefördert.
Aktivitäten 1 -
DCAT is a W3C recommendation for describing datasets on the web. DCAT can be used to describe datasets and data services in a catalog using standard terms that facilitate the consumption and aggregation of metadata from multiple catalogs.
In this tutorial, you will learn
- how important a standardized metadata format is for sharing geospatial data
- how to create DCAT metadata using RDForms
- how to use Docker to download and configure Apache Jena Fuseki Server
- how to use SPARQL to query DCAT metadata
This tutorial is structured as follows:
- Overview
- Background
- Data Sharing and Metadata
- Resource Description Framework (RDF)
- Data Catalog Vocabulary (DCAT)
- DCAT Profiles
- Practical Exercises
- Practical Example of DCAT
- Creating, Editing and Visualizing DCAT metadata with RDForms DCAT Editor
- Running SPARQL Queries on DCAT metadata.
- Summary and Discussion
Target Audience and Prerequisites
This tutorial is designed for students and professionals who want to improve their understanding of Spatial Information Infrastructures, and in particular, how DCAT promotes the reusability and interoperability of spatial data. We assume that you have basic knowledge about the concept of linked data, spatial data and spatial data services (for example Web Map Services (WMS) and Web Feature Services (WFS)). If you dont, you can still proceed with the module as we will not be going into the technical details or usage of the spatial data and data services, but just how they are described using DCAT.
In both cases, you will need about 90 minutes to use this tutorial. It would also be great if you also had some experience with Docker. However, the tutorial will guide you through the various steps of working with Docker and can be used to gain initial hands-on experience with it.
How to use the OER module
Authors and Funding
This Tutorial has been developed in the context of the OER4SDi project at the Institute for Geoinformatics, University of Münster. Authors are James Ondieki and Albert Remke.
The OER4SDI project has been recommended by the Digital University NRW and is funded by the Ministry of Culture and Science NRW.
License Statement
You are free to use, alter and share the content of the tutorial under the terms of the license, unless explicitly stated otherwise for specific parts of the content. All logos used are generally excluded.
Any code provided with the tutorial can be used under the terms of the MIT license. Please see the full license terms: https://github.com/oer4sdi/OER-DCAT/blob/main/LICENSE.md.
The tutorial can be referenced as follows: “OER-DCAT”, OER4SDI project / University Münster, CC BY-SA 4.0.
Aktivitäten 1 -
Das offene Lernmaterial bietet a) einige Hintergrundinformationen zu Geospatial Web Services und b) eine technische Anleitung zur Nutzung von Geospatial Web Services in einem Open Source Gis (QGIS) sowie einem Open Source Server (GeoServer).
Das Modul ist wie folgt aufgebaut
- Überblick
- Thematischer Hintergrund
- Übungen und Leitfäden
- Quiz
- Zusammenfassung
Dieses Tutorial ist hauptsächlich für Studenten gedacht, die etwa 60 Minuten damit verbringen wollen, ihre Fähigkeiten bei der Integration von Daten aus Geosaptial Web Services zu verbessern. Du solltest einige Grundkenntnisse in GIS-Software haben und es wäre nicht schlecht, wenn du bereits einige Erfahrung mit der freien Open-Source-Software Geoserver haben.
Das OER ist als H5P-Modul implementiert, das heruntergeladen und in jede H5P-Laufzeitumgebung eingebettet werden kann, wie z.B.:
- Lernmanagementsysteme auf Basis von Moodle oder Ilias
- H5P-Bearbeitungsumgebungen wie der H5P Official Editor oder der leichtgewichtige LUMI H5P Editor
- Inhaltsverwaltungssysteme wie Wordpress mit installiertem "H5P"-Plugin
Lade dir einfach nur die H5P-Datei herunter, lade sie in eine der Umgebungen hoch und verwende sie von dort aus.
Schneller Überblick über den Inhalt
Wenn du dir zunächst einen schnellen Überblick über die konkreten Inhalte des H5P-Moduls verschaffen willst, findest du im Storyboard ein nach dem H5P-Modul strukturiertes Skript mit integrierten Illustrationen.
Sie dürfen den Inhalt des Tutorials unter den Bedingungen der CC-BY-SA 4.0 Lizenz frei verwenden, verändern und weitergeben, sofern nicht ausdrücklich etwas anderes für bestimmte Teile des Inhalts angegeben ist. Alle verwendeten Logos sind generell ausgenommen.
Jeglicher Code, der mit dem Tutorial zur Verfügung gestellt wird, kann unter den Bedingungen der MIT-Lizenz verwendet werden. Bitte lesen Sie die vollständigen Lizenzbedingungen: https://github.com/oer4sdi/OER-GeospatialWebServices/blob/main/LICENSE.md.
Das Tutorial kann wie folgt referenziert werden: „OER-GeospatialWebServices“, OER4SDI Projekt / Hochschule Bochum, CC BY-SA 4.0.
Diese OER-Module wurden im Kontext des Projektes OER4SDI am Institut für Geodäsie der Hochschule Bochum in enger Zusammenarbeit mit der Westfälischen Universität Münster und der Ruhr Universität Bochum entwickelt. Hauptautor ist Fabian Przybylak unter der Leitung von Prof. Dr. Carsten Keßler und in Zusammenarbeit mit Lucas Rudnik.
Das Projekt OER4SDI wurde von der Digitalen Hochschule NRW empfohlen und wird durch das Ministerium für Kultur und Wissenschaft NRW gefördert.
Aktivitäten 1 -
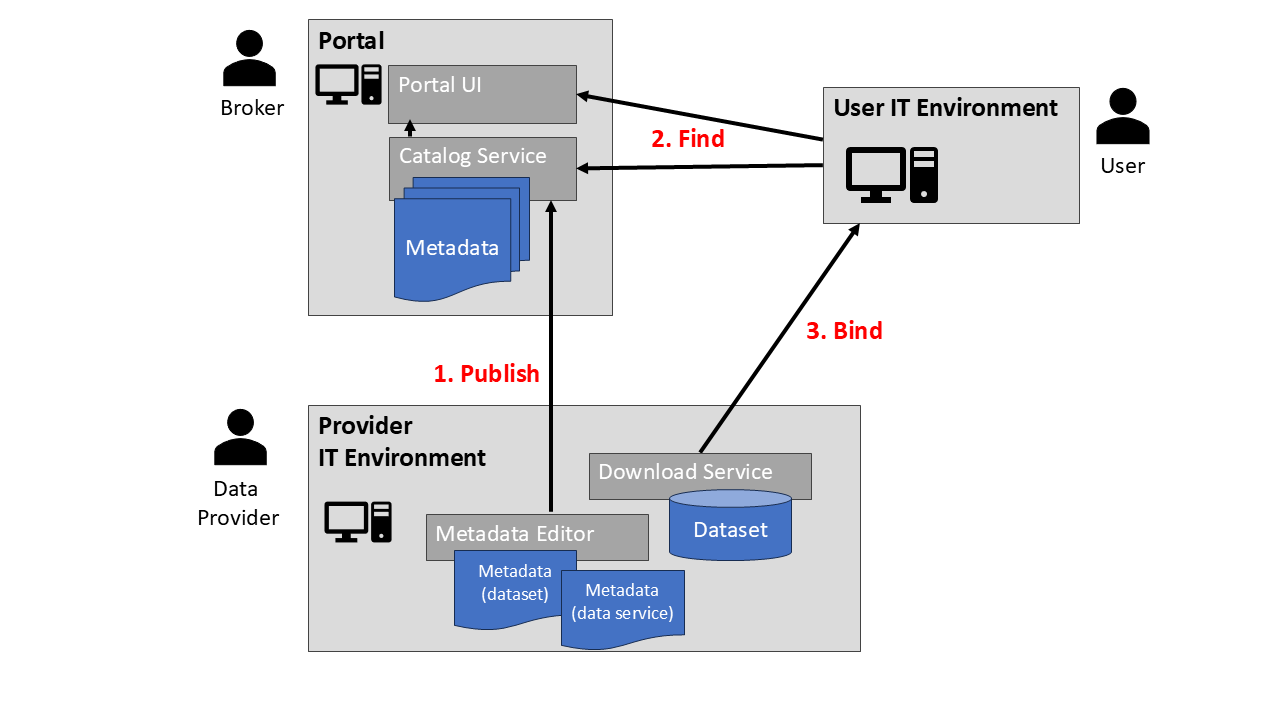 This tutorial will help you understand how metadata is provided and used in SDIs. In particular, we will look at metadata based on ISO standards, as well as interfaces for querying and accessing metadata according to the OGC specification of Catalog Services for the Web (OGC CSW).After completing this tutorial, you will be able to query and use OGC Catalog services via Python and QGIS.
Content structure
- Overview- Background- Practical examples for using CSW Catalog Services- Summary and Notes on Related TopicsHow to use the learning material
Just download the PDF file and follow the instructions. The learning material will guide you through practical exercises that require to download and install QGIS, DockerDesktop, Jupyter Server and a Python Notebook.The tutorial takes about 90 Minutes for reading and viewing the provided materials, downloading the software and for conducting the hands-on exercises and tasks.This OER is primarily designed to be used by students in Geoinformatics, Geomatics and similar study programs. It is also useful for students of other study programs and for practitioners who want to enhance their understanding of SDI concepts and technologies. Some basic knowledge of web technologies such as HTTP and Web Services is required. However, you will be able to follow and find links to further resources if needed. Your computer should have 8 GB of usable RAM and 2 GB of usable disk space to download and use the software for this tutorial.Authors and Licensing
This Tutorial has been developed at the Institute for Geoinformatics, University of Münster. Authors are Tobias Krumrein and Albert Remke.You are free to use, alter and share the content of the tutorial under the terms of the CC-BY-SA 4.0 license, unless explicitly stated otherwise for specific parts of the content. Any code provided with the tutorial can be used under the terms of the MIT license. Please see the full license terms.The tutorial can be referenced as follows: “OER-MetadataAccessVia-OGC-CSW”, OER4SDI project / University Münster, CC BY-SA 4.0. All logos used are generally excluded.The OER4SDI project has been recommended by the Digital University NRW and is funded by the Ministry of Culture and Science NRW.Aktivitäten 1 -
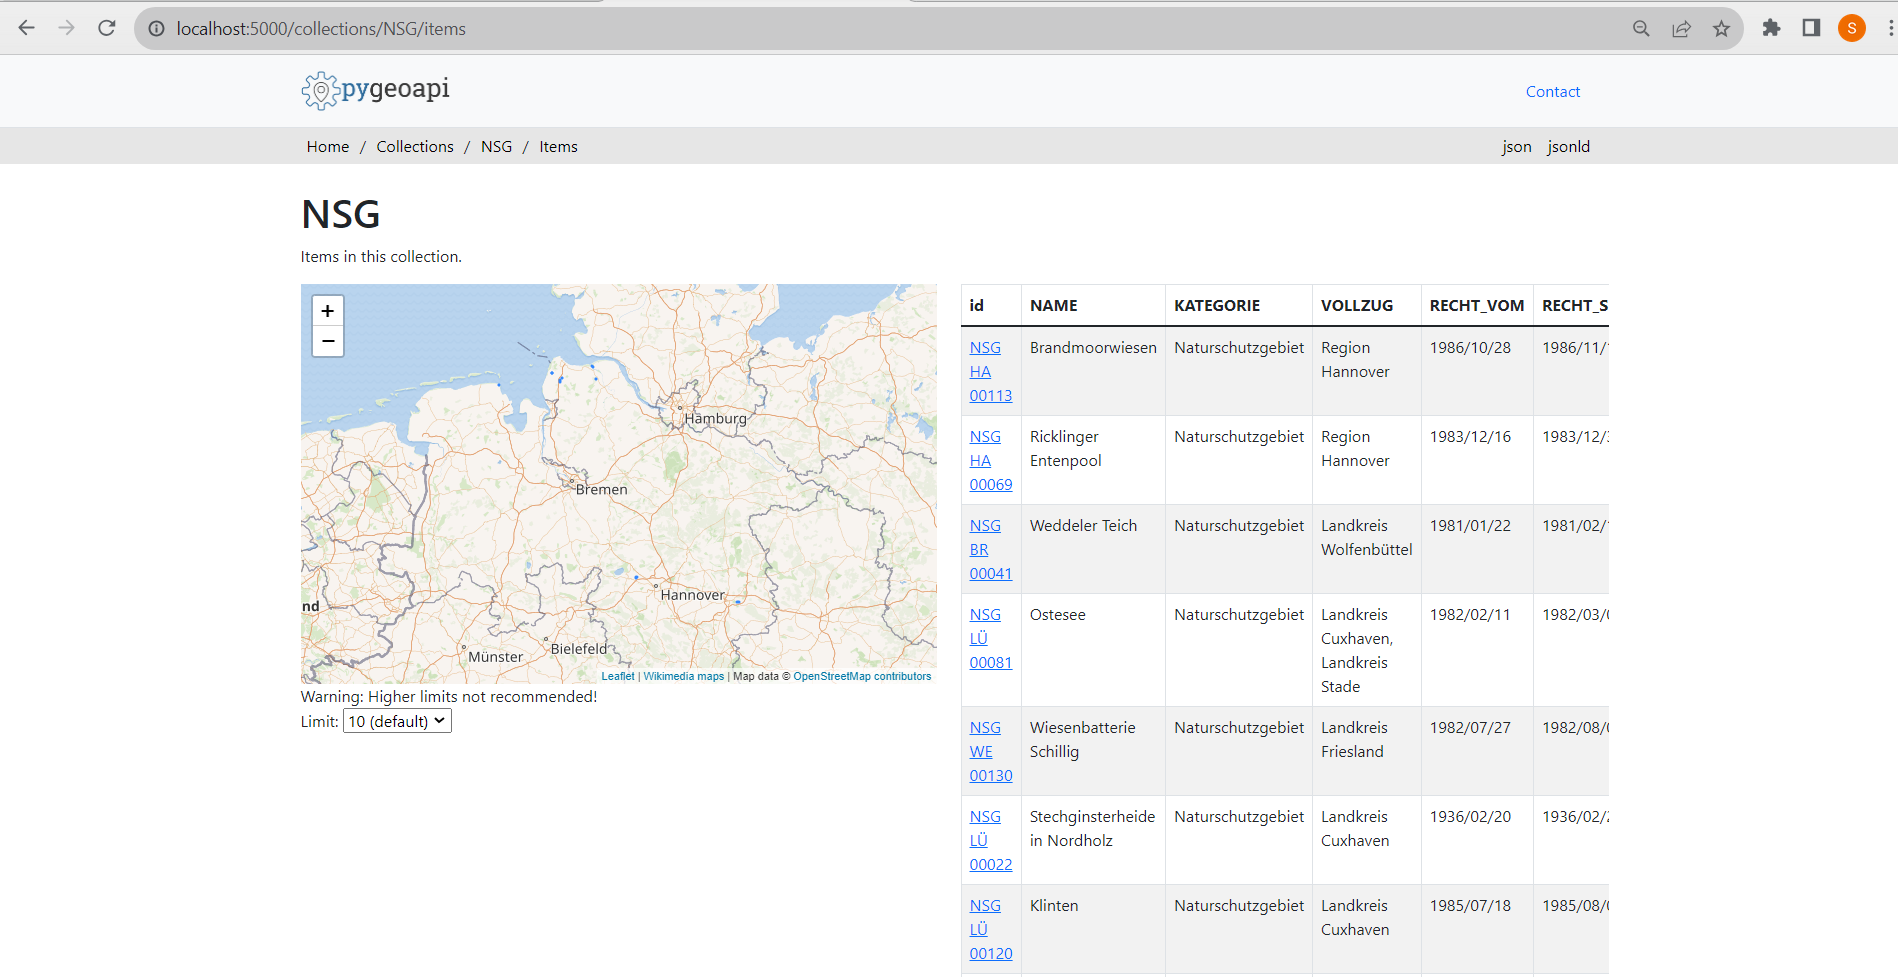 In this tutorial you will learn how to access geospatial data using web services that implement the OGC API Features interface.
- You will use docker images to install and run an OGC API Features server on your local computer providing data on nature reserves
- You will learn how to interact with this service instance in various ways: a) with a browser b) with QGIS c) with Python from a Jupyter notebook
Structure of the tutorial
1. Overview2. Background- Feature Data and Feature Services- Advantages of accessing data with OGC Web Services- OGC-API series of interface specifications- OGC-API Features interface3. Practical exercises- Use cases and technical setting- Installing software and data- Using the web browser to interact with the OGC-API Features service- Using QGIS to access feature data via the OGC API Features interface- Using Python to interact with the OGC-API Features service4. Summary and DiscussionTarget Audience and Prerequisites
This tutorial is designed for students and professionals who want to improve their understanding of Spatial Information Infrastructures. We assume that you have some basic knowledge about geospatial data, QGIS and Python. In this case you will need about 90 minutes to use this tutorial.It would be great if you also had some experience with Docker and Jupyter Notebooks. However, the OER will guide you through all of these technologies and can also be used to gain initial hands-on experience with them.How to use the OER Module
The tutorial is implemented both, as a PDF and as an H5P document.Just activate one of the documents, read the content and follow the instructions.Open License
This Tutorial has been developed in the context of the OER4SDi project at the Institute for Geoinformatics, University of Münster. Authors are Soumya Ganguly and Albert Remke.You are free to use, alter and share the content of the tutorial under the terms of the [CC-BY-SA 4.0](https://creativecommons.org/licenses/by-sa/4.0/deed.de) license, unless explicitly stated otherwise for specific parts of the content. All logos used are generally excluded. Any code provided with the tutorial can be used under the terms of the MIT license. Please see the full license terms:https://github.com/oer4sdi/OER-DataAccessVia-OGC-API-Features/blob/main/LICENSE.mdThe tutorial can be referenced as follows: “OER-DataAccessVia-OGC-API-Features”, OER4SDI project / University Münster,[ CC BY-SA 4.0](https://creativecommons.org/licenses/by-sa/4.0/legalcode.en).The OER4SDI project has been recommended by the Digital University NRW and is funded by the Ministry of Culture and Science NRW.Aktivitäten 2 -

Analyzing IoT air quality sensor data streams using Kafka and Jupyter Notebooks
In this tutorial you will learn how to use Kafka and Jupyter notebooks to process and analyze streams of sensor data (particulate matter, PM2.5).
After you have completed this tutorial, you will know how to
-
use Docker to install and run Apache Kafka and Jupyter Notebooks on your local computer
-
use Python to access and download PM2.5 sensor data from the Open Sensemap project
-
simulate a PM2.5 sensor data stream that runs against Kafka and how to analyze that data stream for monitoring air quality
The module is structured as follows:
- Overview
- Background on IoT, sensor data streams and the air quality parameter particulate matter (PM2.5)
- Installing and using Apache Kafka and Jupyter Notebooks for analyzing PM2.5 data streams
- Wrap up
The OER is designed for students and professionals who want to improve their skills in developing applications for near-real-time data. Users should have some basic knowledge of Python and it would not be bad to have some experience with Docker and Jupyter notebooks as well. However, the OER guides you through all these technologies and can also be used to gain some initial practical experience with them.
How to use the OER Module
Simply download the PDF file, read and follow the tutorial..
License Statement
You are free to use, alter and share the tutorial under the terms of the CC-BY-SA 4.0 license, unless explicitly stated otherwise for specific parts of the content. The tutorial can be referenced as follows: “OER-SpatialDataStreaming”, OER4SDI project / University Münster, CC BY-SA 4.0.
All logos used are generally excluded.
Any code provided with the tutorial can be used under the terms of the MIT license. Please see the full license terms.
Authors and funding
The tutorial has been developed at the Institute for Geoinformatics, University of Münster. Authors are Jaskaran Puri and Albert Remke, with contributions from Sandhya Rajendran and Thomas Kujawa. The latest version of this tutorial is always available on GitHub. We hope you will use GitHub issues to provide feedback and suggest improvements.
The OER4SDI project has been recommended by the Digital University NRW and is funded by the Ministry of Culture and Science NRW.
Aktivitäten 1 -
-
INSPIRE stands for “Infrastructure for Spatial Information in Europe”. The European INSPIRE legislation requires public sector institutions in the member states to provide access to spatial data via so-called view services and download services. INSPIRE also provides technical recommendations on how these services can be implemented on the basis of international standards such as classic OGC Web Map Services (WMS) and OGC Web Feature Services (WFS) or the newer OGC API type of services.
In this technical tutorial, we will explore how to work with INSPIRE view and download services. Learning objectives are:
- Understanding the characteristics of INSPIRE view and download services.
- Gaining practical experience in working with these resources
Content Structure
The tutorial is structured as follows:
- Background
- INSPIRE in a nutshell
- INSPIRE data themes
- INSPIRE view services
- INSPIRE download services
- Practical example on working with INSPIRE view and download services
- Finding data on protected sites
- Creating a map of protected sites using INSPIRE view services
- Accessing data on protected sites using INSPIRE download services
- Discussion
- Check your knowlegde
Target Audience and Prerequisites
This tutorial is designed for students and professionals who want to improve their understanding of Spatial Information Infrastructures. We assume that you have some basic knowledge about spatial data, QGIS and Python. In this case you will need about 90 minutes to use this tutorial.
How to use the OER Module
Simply download the PDF document “OER-Inspire View and Download Services”, read the content and complete the tasks included.
Authors and Funding
This Tutorial has been developed in the context of the OER4SDi project at the Institute for Geoinformatics, University of Münster. Authors are Hamidreza Behbood and Albert Remke.
The OER4SDI project has been recommended by the Digital University NRW and is funded by the Ministry of Culture and Science NRW.
License Statement
You are free to use, alter and reproduce this open educational resource (OER) under the terms of the CC-BY-SA 4.0 license, unless explicitly stated otherwise for specific parts of the content.
The tutorial can be referenced as follows: “OER-INSPIREViewAndDownloadServices”, OER4SDI project / University Münster, CC BY-SA 4.0.
All logos used are generally excluded.
Any code provided with the tutorial can be used under the terms of the MIT license. Please see the full license terms.
Aktivitäten 1 -
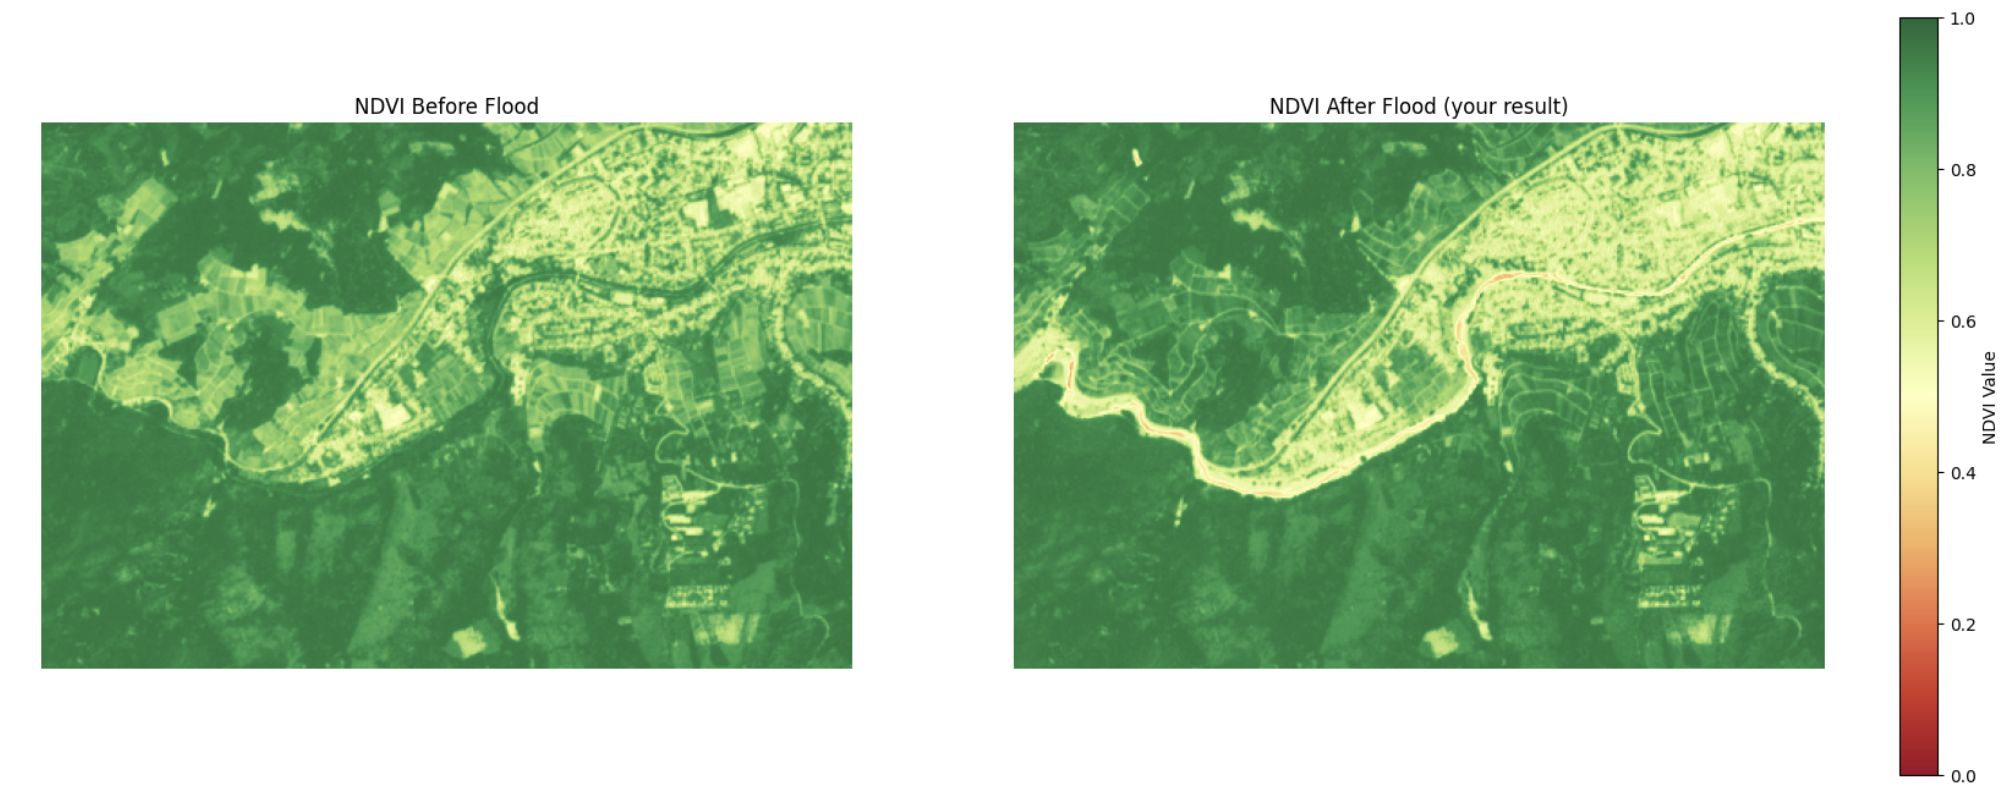 In this technical tutorial on the Copernicus Data Infrastructure, you will learn about the Copernicus Data Space Ecosystem and how to process EO data using Python and OpenEO. After working through the tutorial, you will be able to
-
understand the purpose and scope of the Copernicus EO infrastructure
-
understand the role of the Copernicus Data Space Ecosystem and OpenEO for accessing and processing Copernicus data
-
use Python to create information products from Earth observation data using the Copernicus Data Space Ecosystem and OpenEO.
Structure of the tutorial
1. Overview
2. Background
- The Copernicus Program
- The Copernicus Data Space Ecosystem
- Processing of EO Data with Python and openEO
3. Hands-on Exercise
- Exercise Overview
- Preparation
- Walk through the Python Notebook
4. Summary
Target Audience and Prerequisites
This tutorial is designed for students and professionals who want to improve their understanding of Spatial Information Infrastructures. We assume that you have some basic knowledge about remote sensing, Python and web technologies. However, even without this prior knowledge you will be able to follow and to achieve the main learning objectives. Your computer should have 8 GB of usable RAM and 2 GB of usable hard disk space to download and use the software for this tutorial. The Tutorial takes about 60 minutes for reading and viewing the provided materials, downloading the software and for conducting the hands-on exercises and tasks.
The latest version of this tutorial is always available on GitHub. You are invited to use GitHub issues to provide feedback and suggest improvements.
How to use the OER Module
Just activate the PDF document, read the content and follow the instructions.Open License
This Tutorial has been developed in the context of the OER4SDi project at the Institute for Geoinformatics, University of Münster. Authors are Tobias Krumrein and Albert Remke.You are free to use, alter and share the content of the tutorial under the terms of the [CC-BY-SA 4.0](https://creativecommons.org/licenses/by-sa/4.0/deed.de) license, unless explicitly stated otherwise for specific parts of the content. All logos used are generally excluded. Any code provided with the tutorial can be used under the terms of the MIT license. Please see the full license terms:The tutorial can be referenced as follows: “OER-CopernicusAndOpenEO”, OER4SDI project / University Münster,[ CC BY-SA 4.0](https://creativecommons.org/licenses/by-sa/4.0/legalcode.en).The OER4SDI project has been recommended by the Digital University NRW and is funded by the Ministry of Culture and Science NRW.Aktivitäten 1 -
-
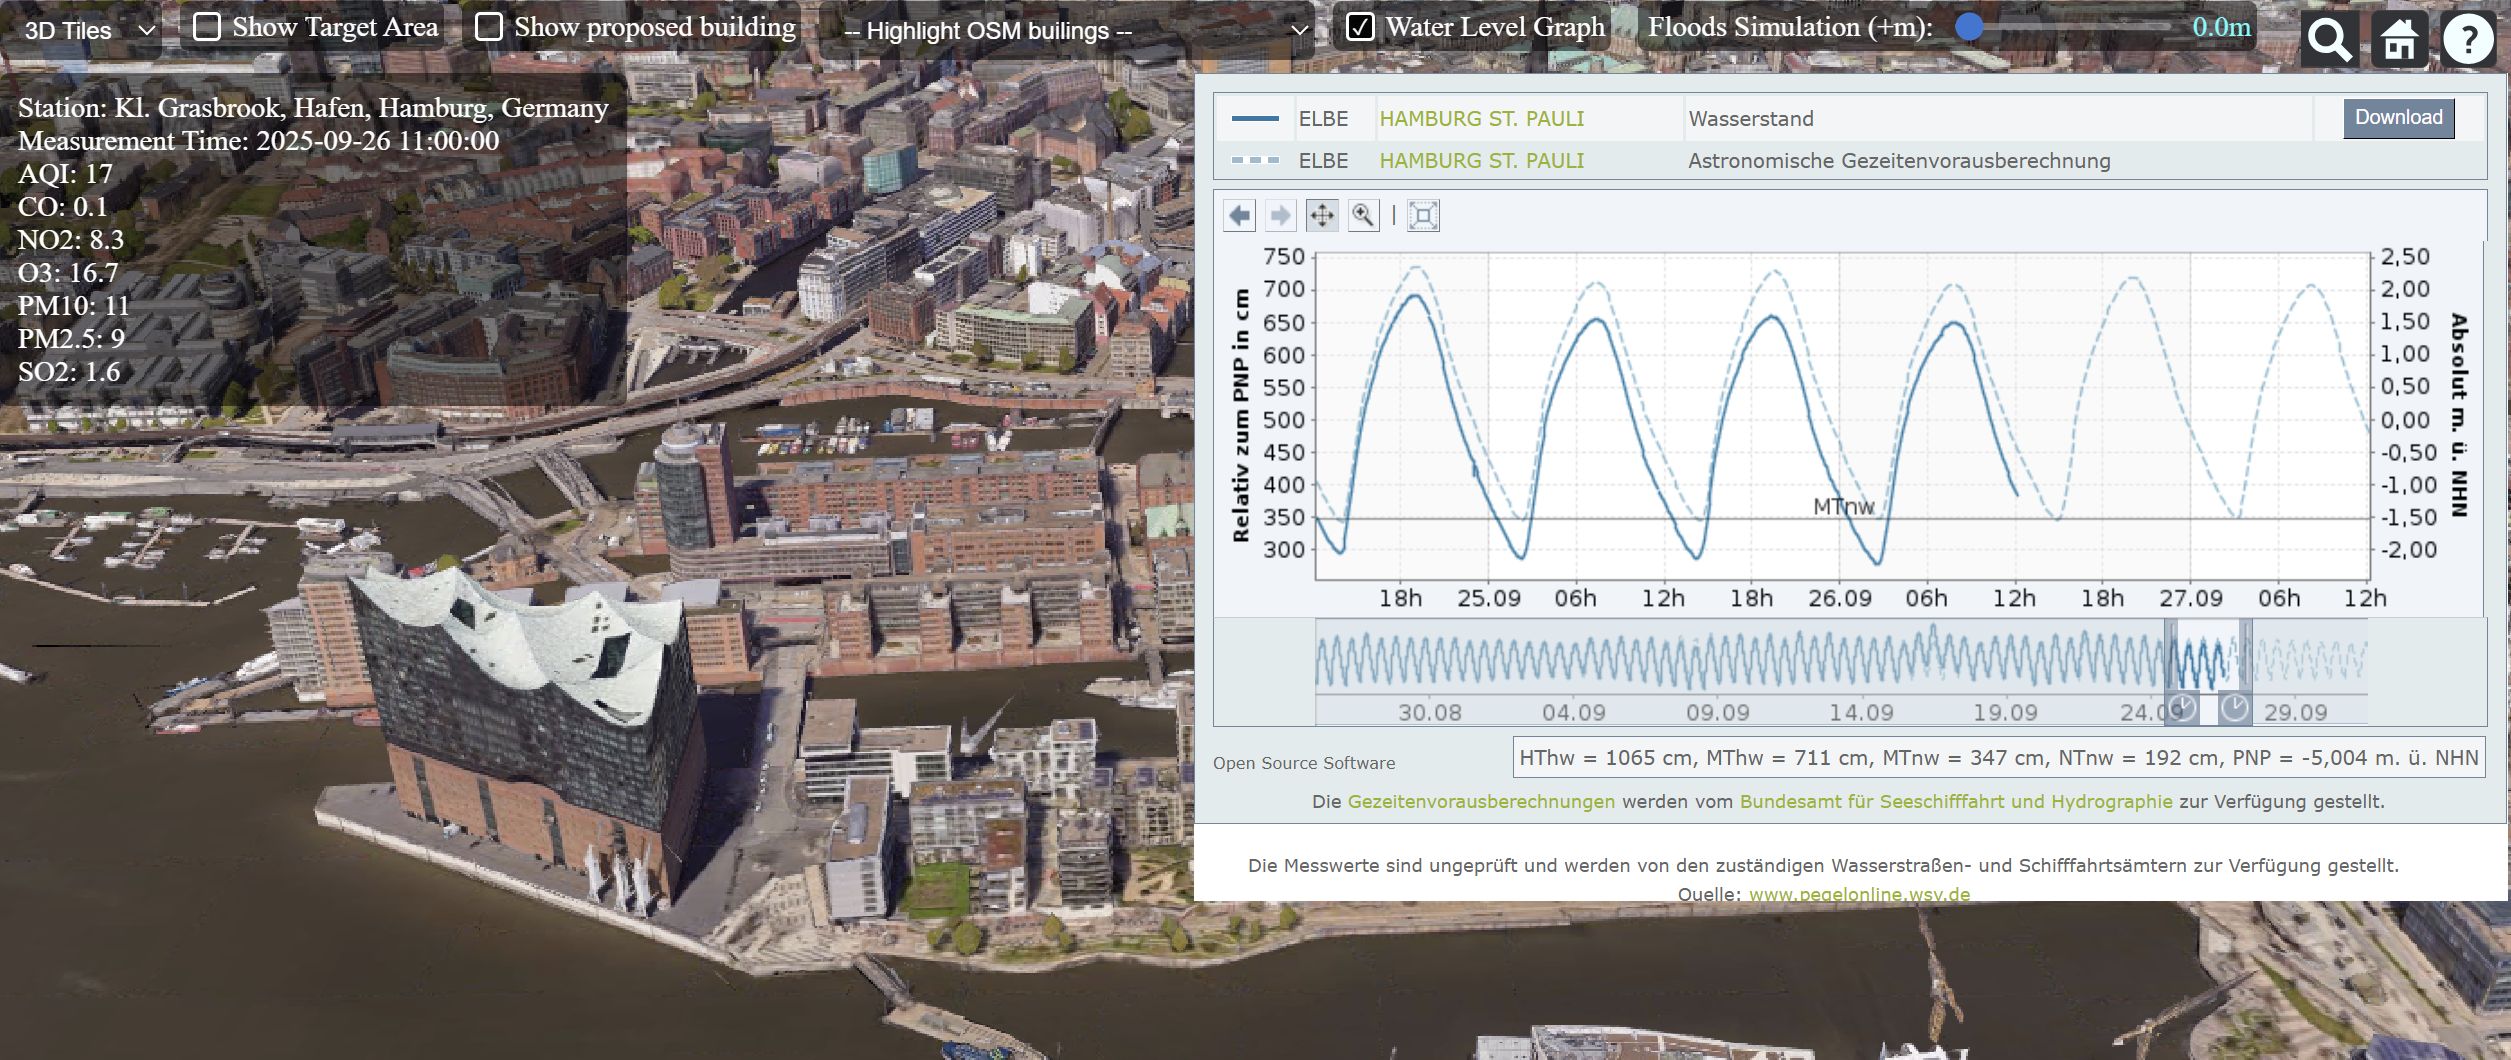
In this OER module, you will learn about the concept of geospatial digital twins and explore some fields of application. You will create a simple digital twin application using publicly available datasets from the City of Hamburg.
In the practical exercise, you will use:
- CesiumJS, an open-source JavaScript library for 3D geospatial visualization.
- CesiumION, a platform for streaming, storing, and tiling 3D data.
- Real-time water level data from PegelOnline
- Real-time air quality data from AQICN.org
- Docker to set up and run our application
This tutorial is structured as follows:
- Overview
- Background
- The idea of Digital Twins
- Components of a Digital Twin
- What is so special about Digital Twins
- Application Areas of Digital Twins
- Case study - Hamburg City's Digital Twin Initiatives
- Practical Exercises
- Setting Up the Digital Twins application
- Exploring the Digital Twins application
- Air quality at different locations
- Flood Simulation
- Visualize a Proposed Building
- Summary and Discussion
Target Audience and Prerequisites
This tutorial is designed for students and professionals who want to improve their understanding of Spatial Information Infrastructures, and in particular, learning more about the concept of Digital Twins. This tutorial requires some basic knowledge of geodata and geographic information systems. Knowledge on Docker would be helpful, but is not absolutely necessary as this tutorial will guide you through the various steps of working with Docker.
You will need about 90 minutes to work through this tutorial.
How to use the OER module
Simply download the PDF file, read and follow the tutorial.
Authors
This OER module has been developed at the Institute for Geoinformatics (IFGI), University of Münster, in collaboration with 52°North GmbH. Authors are James Ondieki, Simon Jirka and Albert Remke.
License Statement
You are free to use, alter and share the content of the tutorial under the terms of the CC-BY-SA 4.0 license, unless explicitly stated otherwise for specific parts of the content. All logos used are generally excluded.
Any code provided with the tutorial can be used under the terms of the MIT license. Please see the full license terms: https://github.com/oer4sdi/OER-DIGITAL-TWINS/blob/master/LICENSE.md.
The tutorial can be referenced as follows: “OER-DIGITAL-TWINS”, OER4SDI project / University Münster, CC BY-SA 4.0.
Aktivitäten 1 -
Der Kurs erklärt die Nutzung von Docker zur Bereitstellung und Skalierung von Anwendungen in geografischen Informationssystemen (GIS). Docker ermöglicht das Erstellen isolierter Umgebungen, sogenannte Container, die unabhängig vom Betriebssystem laufen. Diese Container erleichtern die Entwicklung, Bereitstellung und das Experimentieren mit GIS-Tools und Daten. Es wird gezeigt, wie man mit Docker eine einheitliche Softwareumgebung für Webdienste und Analyseplattformen wie Jupyter Notebook schafft, um räumliche Analysen effizient und ohne umfangreiche Softwareinstallationen durchzuführen. Docker sorgt so für eine konsistente und flexible Arbeitsumgebung im GIS-Bereich.
Nutzung
Sie Können die Lerneinheit direkt hier auf OpenRUB abrufen.
Sie dürfen das Tutorial (Videos,Text) unter den Bedingungen der CC-BY-SA 4.0-Lizenz frei nutzen, ändern und reproduzieren. Jeder Code, der mit dem Tutorial bereitgestellt wird, kann unter den Bedingungen der MIT-Lizenz verwendet werden. Die vollständigen Lizenzbedingungen finden Sie unter https://github.com/oer4sdi/OER-MetadataAccessVia-OGC-CSW.
Dieses Tutorial wurde am Institut für Geographie der Ruhr Universität Bochum entwickelt. Die Autoren sind Henryk Hodam, Lars Tum Andreas Rienow. Das Projekt OER4SDI wurde von der Digitalen Hochschule NRW empfohlen und wird vom Ministerium für Kultur und Wissenschaft NRW finanziert.
Das Projekt OER4SDI, das sich mit offenen Bildungsressourcen im Bereich der räumlichen Dateninfrastruktur befasst, erhält seine Empfehlung von der Digitalen Hochschule NRW und finanzielle Unterstützung vom Ministerium für Kultur und Wissenschaft NRW. Diese Unterstützung unterstreicht die Bedeutung des Projekts für die Bildungslandschaft in Nordrhein-Westfalen und darüber hinaus.
Aktivitäten 0
