4a. Tutorial - Optimal Unit Commitment
Display and analyize results
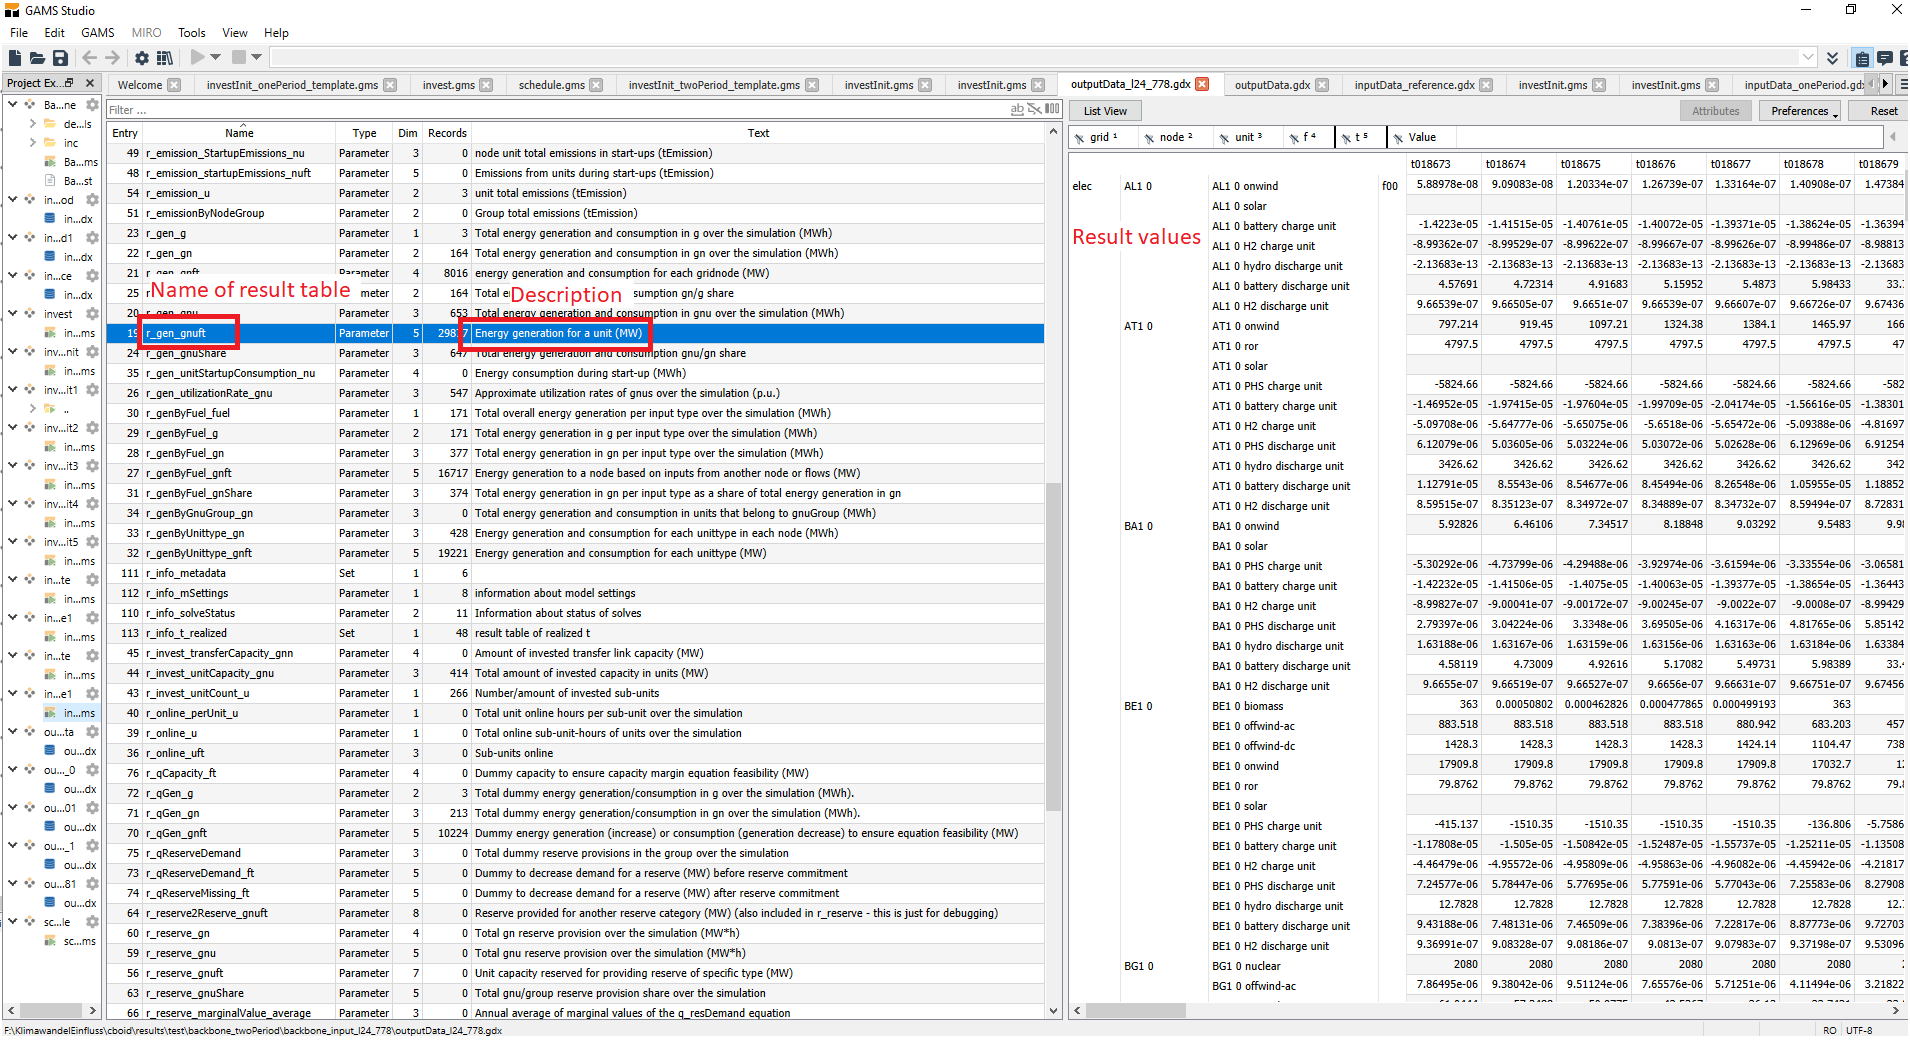
After sucessfully running backbone, you will find a file named "results.gdx" in the folder backbone/output. This is the main output file of backbone. It contains all results from the optimization. You can open it with GAMS studio to look into the results. On the left, you will see a table containing all result tables. Next to the tables, there is a description of the results table (maybe you have to enlarge this part of the window to see this information). If you click on a result table, it will be displayed on the right. There are a lot of very small numbers in the results. This is due to the solving algorithm. You can ignore every value, that is smaller than 1.

The gdx file provides a good overview over all results, however, it is not optimal to analysis results. Therefore, the most important tables are also saved as excel files. This tables are:
r_gen_gnuft - energy generation from a unit (MW)
r_invest_unitCount_u - number of invested units
r_state_gnft - node state at timestep t (MWh)
r_qgen_gnft - dummy energy generation/consumption at timestep t (MW)
r_cost_realizedCost - total realized system cost over the simulation (MEUR)
For the analysis of the first tutorial, we will only need r_gen_gnuft. The meaning of the other tables will be explained in further tutorials.
Note: On Mac and Linux machines, no Excel files are exported automatically. To manually export the sheets you need, use the Export button in GAMS studio.

